
What can you achieve with a power meter?
17 August 2017
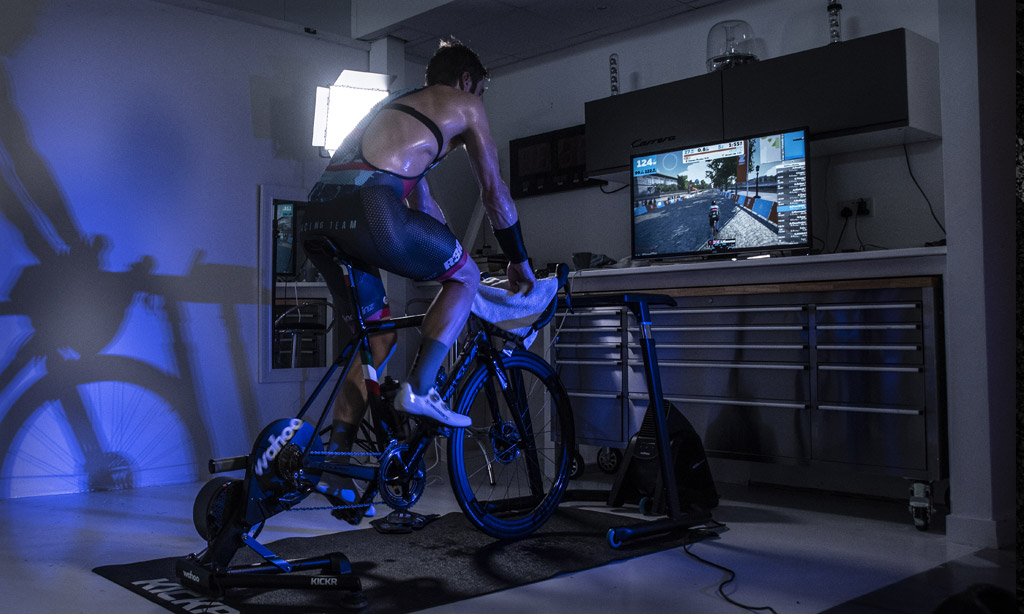
Powermeter in the heat of battle
17 August 2017
We continue the list from the previous article. What else can we achieve with a power meter?
7.You may compare yourself with other athletes
There are many graphics on the internet that compare the power values obtained by different athletes. Strava is also a big source of knowledge. Knowing the individual parameters (best expressed in watts generated per kilogram of body weight – W/kg) enables you to see how far you are from beating a friend on the local uphill or reaching the podium of the national masters Championship in time trial. This way you can get an idea of whether the goals you set are realistic or not.

You can compare yourself now with the help of our experience – enter “The progress of our athletes”.
8. You will easily be able to track your progress
During subsequent tests of power and training you can see whether the power values go up or down, or maybe they keep the same values. We can then respond by changing the nature of training loads, releasing or accelerating the loads or by introducing new stimuli.
Regular tests and racing allow us visualize the current state of our fitness and introduce changes to raise it or, for example, delay the arrival of the peak of the fitness.
9. You will see the distribution of power between the left / right leg
Some devices on the market allow you to measure the percentage distribution of power between the right and left leg. If the difference is greater than 3%, we have the opportunity to work on reducing this disproportion – through consultation with a physiotherapist, appropriate balancing exercises and work on the effectiveness of pedaling.
This parameter is basic when it comes to tracking the cycle of pedaling. Currently, you can also track, for example, the amount of time spent standing up, the percentage of pressure in the individual phases of the pedaling cycle or the power of pulling the pedal up. All this makes it possible to work on and follow the development of the cycle of pedaling, which can sum up to your cycling advantage.

10. You will find the optimal cadence
By repeating subsequent units of training on different values of rhythm and power, we are able to see what cadence is optimal for us at a given time.
Example:
- we do repetitions of 3x15min on 96-105% of FTP in flat terrain
- 1. repetition: cad. 95, avg 97%
- 2. repetition: cad 94, avg 96%
- 3. repetition: cad. 101, avg 100%
- based on this workout, we can draw a hypothesis that the athlete generates optimal power in the flat terrain at the rhythm of about 100.
- confirmation of this hypothesis can be found (or denied) in the analysis of successive training files, preferably racing ones (when we mostly use the “natural” rhythm and often choose the cadence unconsciously)
11. You will set the dietary assumptions
Direct measurement of the kilojoule burn values allows you to easily estimate the amount of energy burned during a workout. Adding to this the basic value of metabolism, we gain a fairly precise picture of our daily energy demand. Then we can adjust the caloric content of the diet (or provide data to the nutritionist) to manage our meals.
12. You will avoid overtraining
Tracking current loads through the Performance Management Chart tool lets you see if we’re pulling the string too tight. There are certain parameters to assess (in different cases) whether the applied load is not too high. In conjunction with (always prioritized) feelings of the athlete, it gives us a fairly full picture of the current state of the fitness and possible fatigue.
Think about how many times you have had a fantastic training period and a great series of races, and then a crisis, smaller or larger, came from somewhere out of the blue. With the help of this tool (among others) we can measure the size of the crisis, go out of it and prevent it.

13. You can compare power with heart rate
Using the power meter does not give us the permission to stop analyzing the pulse graphs. At least for the coach :). The reference of the historical pulse values to the current (at a given power range) is invaluable in analyzing the increase / decrease in aerobic capacity, the degree of recovery between intervals or the evaluation of muscle acidification in subsequent repetitions. You can also see to what extent the athlete got involved in a given effort, regardless of the results of the power meter.


